
Why are female leaders doing worse?
In a previous post of August 2020, I discussed a ‘scientific paper’ that went viral. I use inverted commas because to the best of my knowledge the study has never made it into a peer-reviewed journal and remains in a preprint server. You can find the report by Supriya Garikipati and Uma S Kambhapati here. As you might imagine a study that appeared to demonstrate the superiority of female leaders in the management of the Covid-19 pandemic was catnip for progressives everywhere. For a good idea of how they think (or fail to) try this article from the Guardian here.
Returning to the study by Garikipati and Kambhampati, they relied on a somewhat opaque methodology that involved pairing female leaders with male leaders from ‘neighbouring’ countries and comparing death rates. This was not neighbouring in the physical sense of the word but in terms of a small number of demographic factors. I would have found this more convincing if the pairing had not been post hoc but defined before the epidemic. It is impossible to avoid bias (in the statistical sense of the word) creeping in when post hoc pairings of this sort are made. Evidence for this kind of bias is obvious, the female-led counties selected were among the best performing female led countries and conversely, the male-led counties were among the worst in that group. The overwhelming majority of male leaders were excluded from the study.
There has been another study looking at the same problem that failed to show a difference between male and female leaders and unlike the paper by Garikipati and Kambhampati, this was published in the peer-reviewed literature in PLOS One. Of course, that study was not commented on in the mainstream media. Similarly, the blogger William Collins exposed the study by Garikipati and Kambhampati for the sham it always was. You can find his post here.
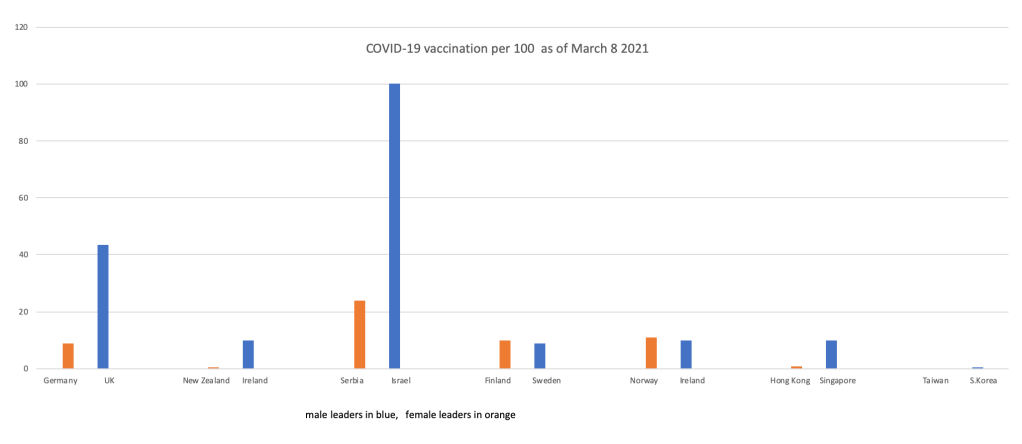
A lot of water has flowed under the bridge since August 2020 and the most important development has been the emergence of several effective vaccines. Now, a good criterion for evaluating leadership is e how effectively they have rolled out vaccination to the population of their countries. I thought a good place to start might be using the original pairings of Garikipati and Kambhampati. Unfortunately, their paper is not clear on the actual pairings used and you have to rely on their account in secondary sources such as The Conversation or The Guardian. For example, New Zealand was twinned with Ireland, Germany with the UK, Sweden with Finland, Bangladesh with Pakistan, Hong Kong with Singapore, Serbia with Israel, Norway with Ireland and Taiwan with S.Korea. When you list the data like this it looks frankly laughable. And it is. The bar chart below shows the rate per 100 of the first COVID-19 vaccination for the paired countries listed above. You will see by and large that those countries with male leaders have done better in rolling out vaccines. The UK is well ahead of Germany, Israel has eclipsed Serbia and Jacinda Adhern is frankly an ‘also-ran’, only 0.2 per hundred have been vaccinated in New Zealand.
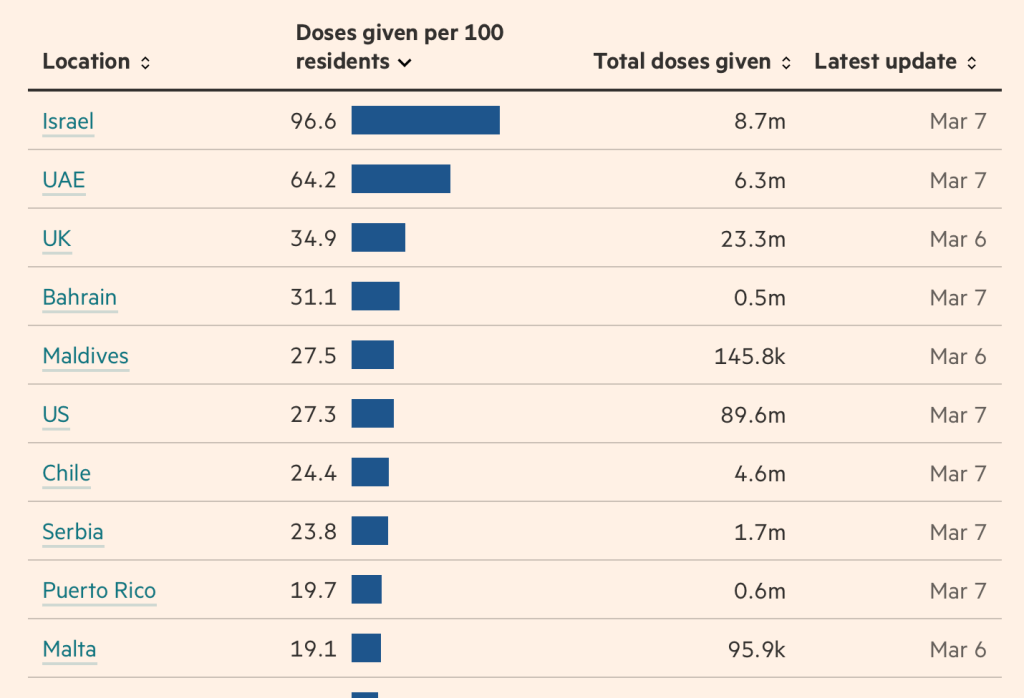
If you look at the top 10 performers in terms of vaccination rate. All but one of these counties (Serbia) are run by men. See the table on the left taken from the Financial Times Covid-19 vaccine tracker.
Another approach might be to average the data for male-led and female-led countries. However, the problem here is that affluent countries are more likely to have female leaders and of course they have more money to spend on vaccines. That being the case, the data needs to be stratified and the simple approach I have adopted is just to look at the top 40 countries in the world according to per capita GDP. A better approach would have involved a more detailed stratification and sometime in the future, when time allows, I may do just that. The data shows that among the richer countries of the world those with male leaders are doing better at vaccinating the population they govern.
| Male Leaders | Female leaders | |
| Average | 15.9 | 7.0 |
| Median | 10.5 | 8.8 |
In truth, I think this analysis is somewhat fatuous but less so than the analysis by Garikipati and Kambhampati that went viral among gullible journalists. What might account for the observed difference between male and female leaders in terms of vaccination rate? Perhaps female leaders became complacent as a result of all the plaudits. Perhaps female leaders were more willing to employ tyrannical over-reach in terms of lockdowns and paid less attention to other routes out of the pandemic. Who knows? I am sure, however, that feminist journalists will find a way of blaming it all on toxic masculinity.

1 comment